k-nearest-neighbour graphs vs similarity thresholds for keyword clustering
A threshold graph keeps every strong relationship. A k-nearest-neighbour graph keeps a fixed number of neighbours. Learn how that choice changes density, outliers and communities.

Farky Rafiq
Founder of ClusterIQ
Before any community-detection algorithm can find keyword groups, someone has to decide which relationships even belong in the graph. Two common ways to make that decision are a fixed similarity threshold and a k-nearest-neighbour rule, and they answer different questions.
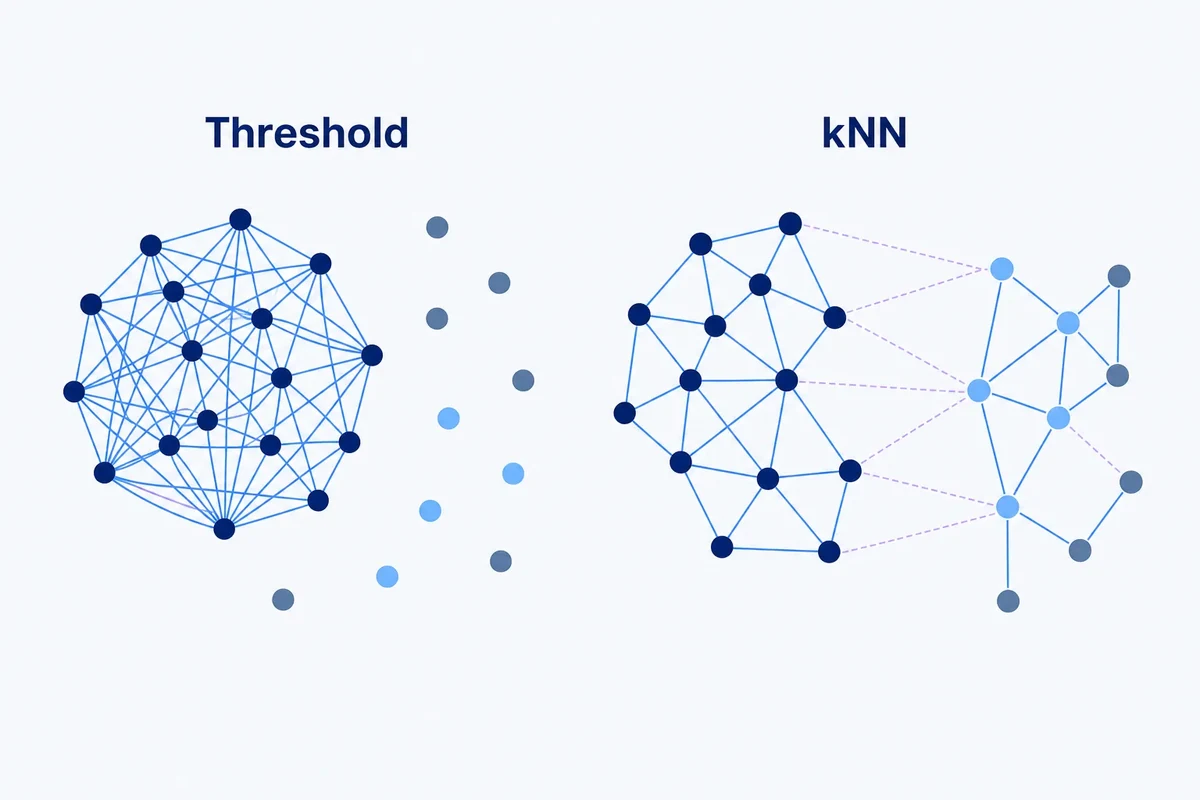
A threshold asks: is this relationship strong enough?
A kNN graph asks: which relationships are strongest for this particular keyword?
Threshold graphs preserve an absolute standard
With a threshold graph, an edge only exists once similarity clears a chosen value. That is easy to explain and stops obviously weak relationships getting into the graph in the first place. The problem is uneven density: a common term might connect to hundreds of neighbours while a specialist query connects to none at all.
kNN graphs preserve a relative neighbourhood
In a k-nearest-neighbour graph, every point keeps its strongest k candidate neighbours, whatever their absolute score happens to be. This gives you a controlled edge count, which is attractive for large datasets. The weakness is that "top five" does not automatically mean "five good relationships". An isolated query still gets nearest neighbours assigned, even if every one of them is weak.
The two methods fail in opposite directions
Threshold graphs risk:
- giant dense regions;
- many isolated nodes;
- heavy dependence on score calibration.
kNN graphs risk:
- forced weak edges;
- artificial connectivity around outliers;
- one-sided relationships.
Mutual kNN is a more conservative option
A mutual-neighbour graph only keeps an edge when A picks B and B also picks A. That removes many weak one-sided relationships and can produce cleaner local structure. It can also fragment legitimate asymmetric neighbourhoods, so test the effect rather than assuming it is automatically better.
A hybrid rule is often the strongest choice
One practical approach is to:
- retrieve the top k neighbours efficiently;
- discard any below a calibrated minimum similarity;
- optionally require mutuality for lower-confidence edges;
- keep stronger one-sided edges where the evidence is compelling.
This keeps computation manageable while still guarding against obviously weak forced connections.
Graph density changes what community detection finds
Louvain and Leiden work with whatever graph you hand them. A dense graph can blur community boundaries. An overly sparse graph can fragment one useful topic into several disconnected pieces. In other words, the edge-construction rule matters just as much as the community algorithm itself. Our article on Louvain versus Leiden is worth reading alongside this graph-construction decision, not on its own.
At scale, retrieval matters more than exhaustive comparison
At 100,000 keywords, comparing every possible pair is wasteful. Approximate nearest-neighbour systems can retrieve a limited candidate set first, and stronger rules can then decide which of those candidate edges survive. This is the architecture described in our large-scale clustering guide.
Check local diagnostics, not just global averages
Global graph statistics can hide real problems. Inspect:
- degree distribution;
- isolated-node rate;
- weakest retained edges;
- neighbour quality for specialist queries;
- largest connected component;
- community stability.
Choose k from the task, not from habit
A value like k=10 or k=20 is not inherently correct. Smaller values emphasise immediate neighbourhoods. Larger values expose broader structure but introduce more cross-topic bridges. Test several values against representative queries and the clusters they actually produce.
Only use thresholds once they are calibrated
Likewise, a threshold such as 0.75 has no universal meaning across different models and datasets. Our similarity-threshold guide explains how to calibrate against labelled relationships and observed graph behaviour rather than picking a number that feels reasonable.
Practitioner principle: graph construction decides which relationships are even eligible to influence the clusters. Community detection cannot recover evidence you removed, or repair weak edges you added in the first place.
Worked example: a dense category and a sparse niche
Imagine one part of the dataset contains thousands of closely related running-shoe queries, while another contains a handful of specialist orthotics terms. A global threshold might give the running-shoe region hundreds of edges per node while leaving the specialist region almost disconnected. A top-k rule controls that imbalance, but it can also force each orthotics query to keep weak neighbours it does not really have. A hybrid rule can retrieve the strongest candidates first and then refuse any edge that fails a minimum evidence threshold.
Watch the weakest retained relationships
One of the fastest quality checks is to look at the lowest-weight edges still in the graph. If those pairs look implausible to a practitioner, the graph construction is too permissive, even if the resulting communities look tidy on a chart. Equally, check isolated high-value queries. If obvious neighbours were filtered out, the graph may be too strict, or the retrieval stage may be missing candidates altogether.
Do not tune the edge rule in isolation from community resolution
Edge construction and community resolution interact with each other. A sparse top-k graph combined with a high Leiden resolution can produce lots of tiny communities, while a permissive threshold graph with low resolution can create broad groups that hide useful distinctions. When comparing configurations, change one layer at a time. First confirm the graph preserves sensible neighbourhoods, then tune the community-detection resolution. Otherwise a weak graph can be made to look acceptable simply by compensating with an aggressive clustering parameter.
ClusterIQ Conclusion
Threshold and kNN graphs offer two different ways to turn semantic similarity into network structure. Thresholds preserve an absolute minimum relationship strength. kNN preserves a controlled local neighbourhood. Hybrid and mutual-neighbour rules can combine their strengths. Evaluate the graph itself before judging the clusters it produces, because the quality of the community structure starts with the edges.
Sources and further reading
Farky Rafiq
Founder of ClusterIQ
I've worked in digital marketing since 2005 and founded Liquid Silver in 2011. These articles are where I share the methods, experiments and practical SEO thinking behind ClusterIQ.
Put the idea into practice with your own keyword data
ClusterIQ helps turn raw SEO exports into clean, structured working datasets you can inspect, refine, report on and take into the next stage of your workflow.
Keep reading
How to choose a similarity threshold for keyword clustering
How to cluster 100,000 keywords without comparing every pair