K-means vs HDBSCAN vs graph clustering: choosing an algorithm for SEO
K-means, HDBSCAN and graph clustering make different assumptions. Compare when each method fits keyword data and why no algorithm determines SEO intent on its own.

Farky Rafiq
Founder of ClusterIQ
You have 1,500 keywords to organise into a content plan. Should every keyword go into a group? Should unusual queries stay separate for review? And how do you handle a term that connects two topics? These practical questions matter more than choosing whichever clustering algorithm is described as the “best”.
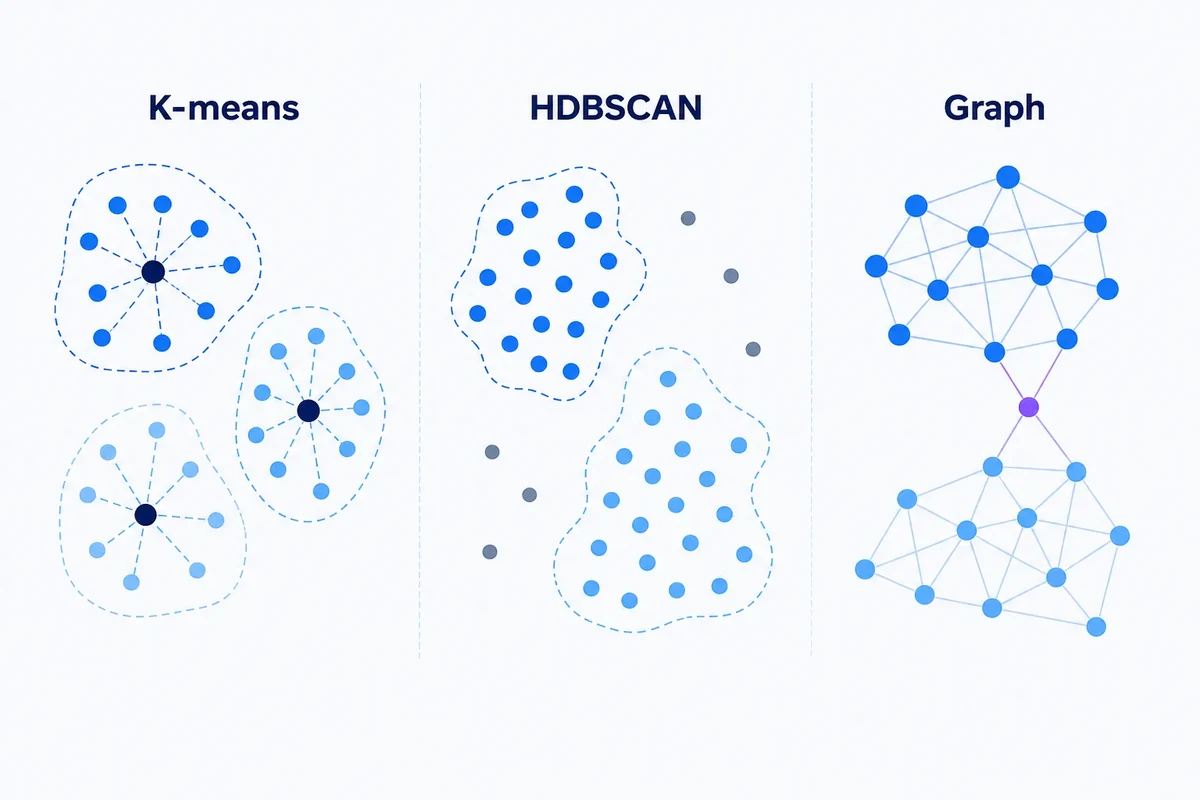
K-means, HDBSCAN and graph community detection answer those questions differently. Each makes assumptions about what a group looks like and how keywords relate to one another. For SEO, the right comparison starts with the decision you need to make: a tidy set of clusters does not automatically translate into a sensible page plan, and a method that works well on one keyword list may be a poor fit for another.
The short version
- K-means is useful when you want a fixed number of groups, each organised around a central point, and you are happy for every keyword to be assigned somewhere.
- HDBSCAN is useful when groups may vary in size and you want weakly connected or isolated keywords to remain unassigned as noise.
- Graph clustering is useful when the connections between keywords matter, particularly when terms link topics together, relationships have different strengths or you want to combine several similarity signals.
None of these methods establishes search intent. They organise the version of your data they are given. How you represent the keywords, and how you check the resulting groups, remain critical.
How K-means approaches the problem
K-means divides your keywords into a number of groups that you choose in advance. Each group has a central point, called a centroid. In scikit-learn, you set the number of groups with n_clusters. The algorithm repeatedly assigns data points to centroids and updates those centroids to minimise the sum of squared distances within the groups.
That makes K-means a useful starting point. It is widely available, comparatively easy to understand and can scale well. If you have a sound reason to want a particular number of groups, it gives you a straightforward way to divide the dataset.
The trade-off is that every keyword gets assigned. An irrelevant or genuinely unusual query cannot be marked “I do not fit”. It goes to the nearest available centroid, even if that match is weak.
When that matters for SEO
A keyword export rarely contains only neat, similarly sized topics. Among 1,500 queries, you might find long-tail fragments, searches for a specific website, unusual product or brand names, and terms included by mistake. Forcing all of them into groups can make the output look tidy while disguising weak matches.
K-means can still work well for exploratory analysis, or when an existing category structure gives you a plausible value of k, the number of groups. Just remember that this number is an assumption you supply, not something the algorithm discovers.
How HDBSCAN approaches the problem
HDBSCAN looks for stable, dense regions: areas where data points sit close together in the chosen representation. You do not have to specify a fixed number of clusters. The reference implementation builds a hierarchy of density-based groups, then selects clusters according to their stability.
Two features are particularly useful for keyword work:
- groups can have different sizes and shapes within the chosen representation;
- keywords that do not belong strongly to a dense region can be labelled as noise.
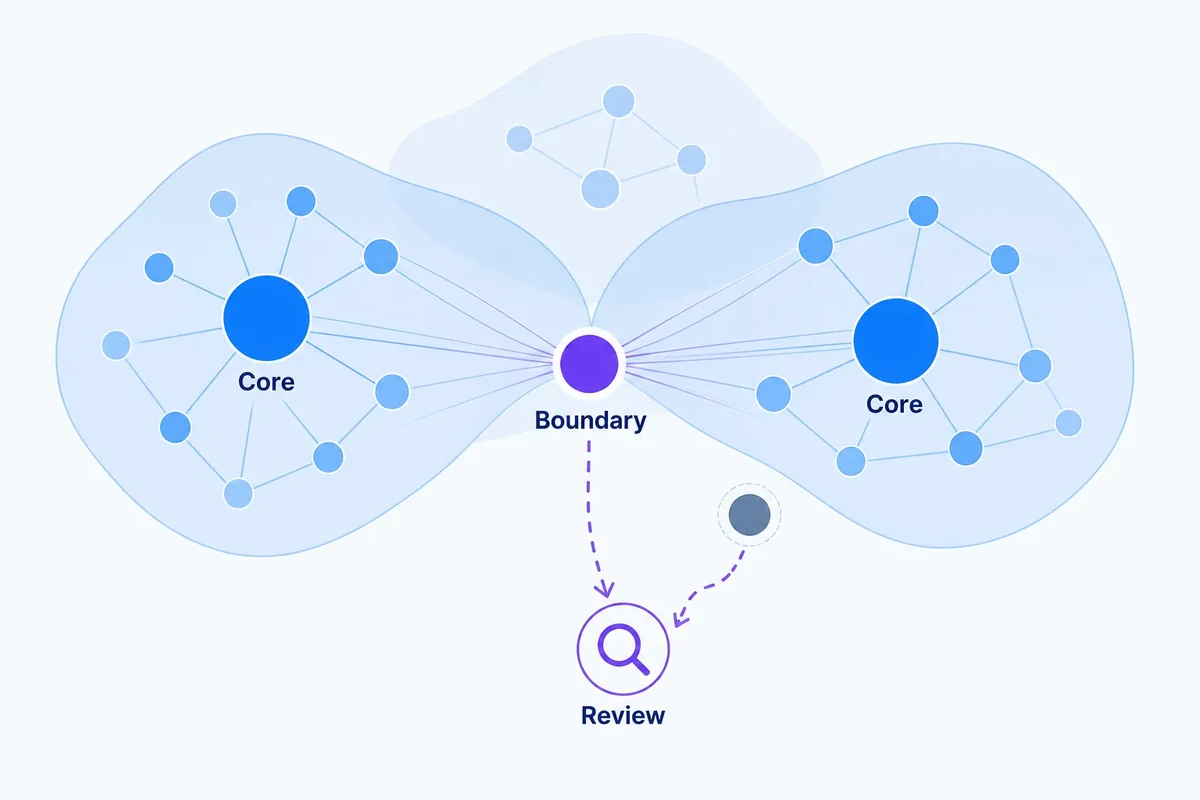
That second feature makes uncertainty visible. If a query does not fit a strong neighbourhood of related terms, you can review it rather than have it quietly attached to the nearest group.
Our guide to HDBSCAN for keyword clustering explores min_cluster_size, min_samples, noise and membership confidence in more detail.
How graph clustering changes the model
A graph starts with connections between keywords, rather than central points or dense regions in a numerical space. Each keyword becomes a node, and selected relationships between keywords become edges. You can give those edges different weights to reflect semantic similarity, shared wording, SERP overlap or a combination of signals.
Community-detection algorithms, such as Louvain or Leiden, then look for groups with stronger connections inside the group than to the rest of the network.
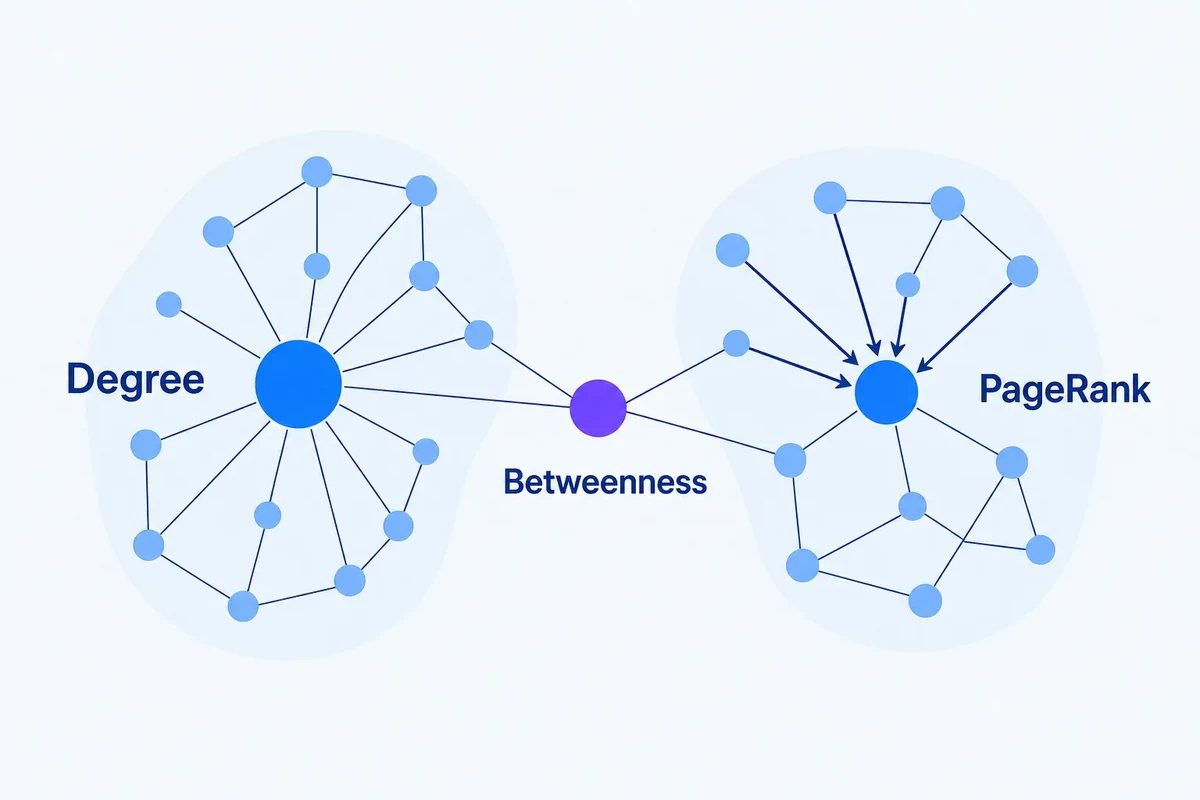
This is useful because a keyword can have more than one meaningful relationship. A query might connect strongly to several concepts, bridge two topic groups, or share wording with one neighbour and search results with another.
The graph keeps those relationships explicit, rather than reducing the output to group membership alone. Our graph theory article explains how this view can reveal bridge terms, central concepts and overlapping topical regions.
Representation can matter more than the algorithm
It is easy to spend time choosing an algorithm and overlook what you are asking it to work with. Clustering methods do not read a keyword list as a marketer would. They work with a numerical or relational representation of it.
For example, TF-IDF vectors represent terms through weighted word usage, while sentence embeddings represent them through learned numerical patterns that capture meaning. K-means over TF-IDF vectors, K-means over sentence embeddings and HDBSCAN over embeddings reduced to fewer dimensions are different modelling pipelines, not just interchangeable algorithm choices.
The same applies to graphs. A graph whose connections come from cosine similarity is different from one that combines meaning, wording and search-result overlap.
Before comparing algorithms, settle on a representation and ask which information it preserves. Our comparison of TF-IDF and semantic embeddings covers that decision directly.
Where K-means tends to be useful
K-means can be a reasonable fit when:
- you need every keyword assigned to a group, with nothing left over;
- you know the expected number of groups, or have a reason for it outside the algorithm;
- groups are reasonably compact in the representation you have chosen;
- you want a simple, fast baseline to compare other approaches against;
- you are exploring the keyword set, rather than automatically deciding which terms belong on each page.
It is less convincing when topic sizes vary dramatically, the list contains many outliers, or you are guessing k only because the algorithm requires a number.
Where HDBSCAN tends to be useful
HDBSCAN can be a good fit when:
- you do not know how many groups to expect;
- you anticipate irrelevant, isolated or unusual queries;
- topics vary in size;
- you want uncertain membership to stay visible;
- nearby points in your representation form dense regions that reflect meaningful relationships.
The main risks are sensitivity to parameter choices and the possibility of treating legitimate but sparse topics as noise. A small set of commercially useful queries might not form a dense enough group. Density and usefulness are not the same thing.
Where graph clustering tends to be useful
A graph approach is worth considering when:
- you want to understand bridge terms and connections between topics;
- the strength of each relationship carries useful information;
- you want to combine more than one type of evidence;
- you want to examine centrality, or how central a keyword is in the network, and neighbouring communities as well as cluster labels;
- the results may help shape your site structure or internal linking.
The main challenge comes before clustering: deciding which connections should exist and how much weight each should carry. Poor rules for building the graph will still produce poor communities.
Do not choose from one internal metric
Measures such as inertia, silhouette score and modularity can help you inspect the results. Broadly, they assess properties such as within-group distances, group separation or the strength of network communities. They do not tell you whether those groups are useful for SEO.
A mathematically coherent cluster can still mix people researching a topic with people ready to buy. A graph can have strong modularity while separating queries that one useful page could reasonably satisfy.
Combine those internal checks with practical questions:
- Are obvious paraphrases grouped together?
- Are queries needing different page types being merged incorrectly?
- Are important names, entities and modifiers preserved?
- Do the outliers make sense?
- Do the same broad topics remain stable when you make small changes to the settings?
- Would someone doing the SEO work make the same URL or content decision from the group?
A hybrid workflow can use more than one method
You do not have to pick one algorithm and use it for every stage of a production workflow.
A useful workflow might use:
- wording-based rules to remove duplicates and obvious variants;
- semantic embeddings to identify potentially related keywords;
- a graph to retain strong relationships between those keywords;
- community detection to find the broad topic groups;
- HDBSCAN or another local method to investigate dense subgroups;
- human review to resolve ambiguous boundaries and make page-level decisions.
Used this way, the algorithms offer different ways to examine the data. You do not have to treat any one of them as the definitive answer.
A practical decision framework
If you need a baseline and have a reasonable idea of how many groups you want, start with K-means. Pay particular attention to keywords it has forced into questionable groups.
If you want groups of different sizes and an explicit category for noise, HDBSCAN is a stronger candidate.
If the connections between topics matter, or you want to combine several signals and inspect bridge concepts, build a graph and evaluate community detection.
Whichever route you take, keep the final SEO decision separate. Search intent, page type, business rules and observed search behaviour can all change what you do with a mathematically valid cluster.
ClusterIQ Conclusion
K-means, HDBSCAN and graph clustering are not interchangeable methods with one overall winner. Each starts from different assumptions.
K-means assigns every keyword to a centroid-based group. HDBSCAN looks for stable, dense regions and allows some keywords to remain as noise. Graph clustering works directly with a network of selected relationships.
Choose the method whose assumptions fit what you want to investigate, then check whether the results help you make the actual SEO decision. A useful algorithm makes uncertainty easier to understand, rather than hiding it behind a cluster label.
Sources and further reading
Farky Rafiq
Founder of ClusterIQ
I've worked in digital marketing since 2005 and founded Liquid Silver in 2011. These articles are where I share the methods, experiments and practical SEO thinking behind ClusterIQ.
Put the idea into practice with your own keyword data
ClusterIQ helps turn raw SEO exports into clean, structured working datasets you can inspect, refine, report on and take into the next stage of your workflow.
Keep reading
Soft clustering and confidence scores: handling ambiguous keywords honestly
Adding new keywords to existing clusters without rebuilding everything