Building cluster-level SEO reporting that explains performance instead of listing keywords
Keyword reports become noisy at scale. Learn how cluster-level reporting can combine demand, visibility, ownership, coverage and change into a clearer view of SEO performance.

Farky Rafiq
Founder of ClusterIQ
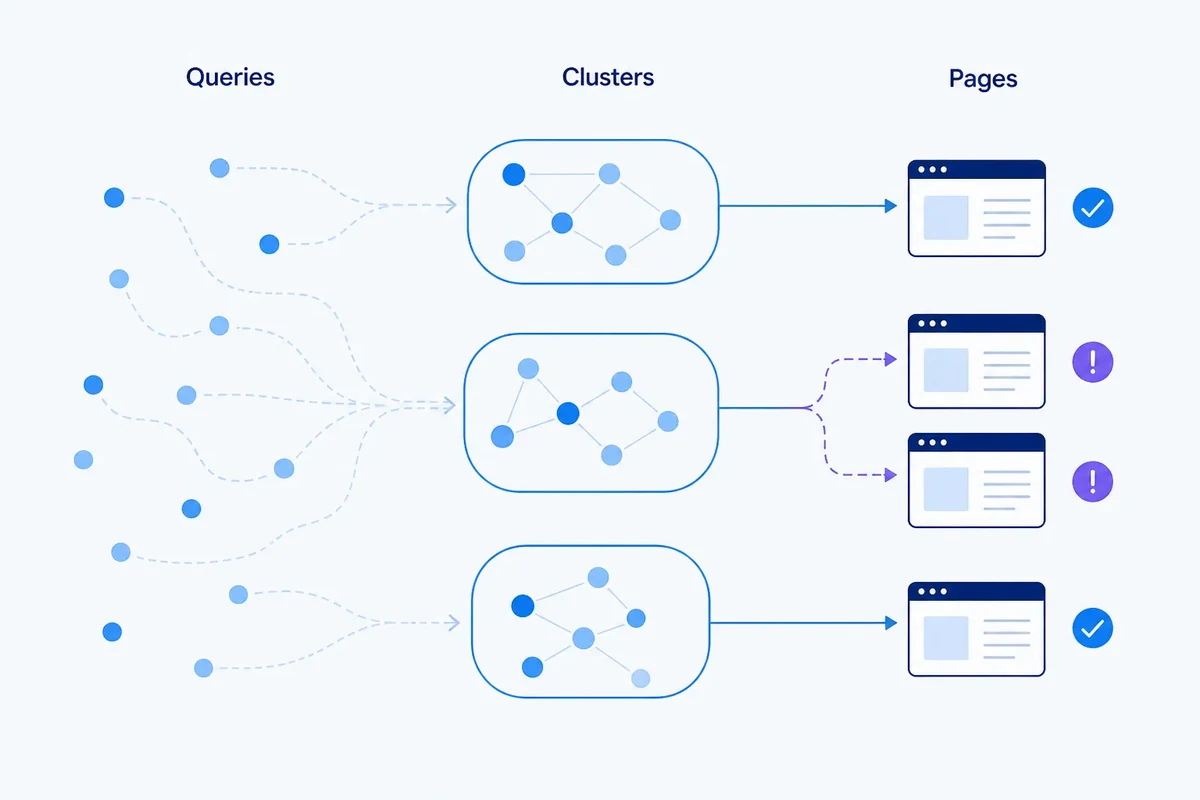
Massive keyword reports are brilliant at generating thousands of rows but notoriously bad at explaining why your traffic actually changed. You can track 50,000 keywords from Ahrefs or Semrush and still find yourself unable to answer a client or manager when they ask which specific topics improved, where the site is losing its grip on page ownership, or which gaps are commercially significant.
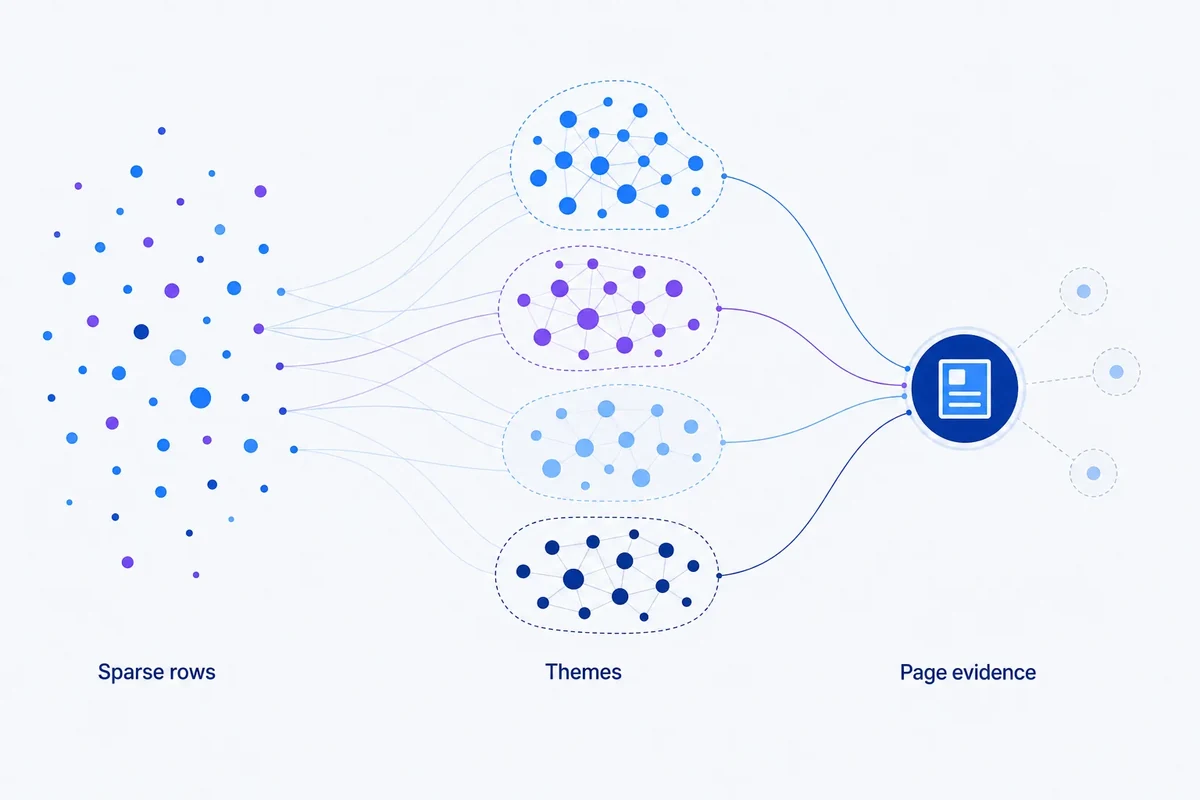
Cluster-level reporting shifts the focus. Instead of obsessing over individual phrases, ClusterIQ uses the topic or task group as the primary unit of analysis. This makes the data far more digestible for stakeholders while keeping the granular detail accessible for the SEOs doing the heavy lifting.
Keep the keyword detail underneath
The goal of cluster reporting is to summarise, not to delete. Every high-level metric should allow you to drill down into the specific queries and URLs that built it. This is a vital safeguard. Without it, a stable topic total might mask a situation where one high-volume keyword is surging while five others are collapsing. You need to see the evidence behind the aggregate.
Report demand separately from performance
It is helpful to keep what the market wants separate from how well you are capturing it. Demand usually stems from search volume estimates, Search Console impressions, or seasonal trends. Performance, meanwhile, is about clicks, visibility, and whether you actually own the top spots. Avoid blending these into a single, mysterious opportunity score. If you do use a combined metric, make sure the weighting is crystal clear so you know if a score dropped because of a Google update or just a seasonal dip in interest.
Use a small set of cluster dimensions
A practical ClusterIQ report should be concise. To explain the current state without creating another bloated spreadsheet, focus on these dimensions:
- Cluster label and ID
- Business priority or importance
- Query count and visible demand
- Clicks and impressions
- The dominant URL and ownership confidence
- Current coverage status
- Change compared to the previous period
Worked example: topic growth with weaker ownership
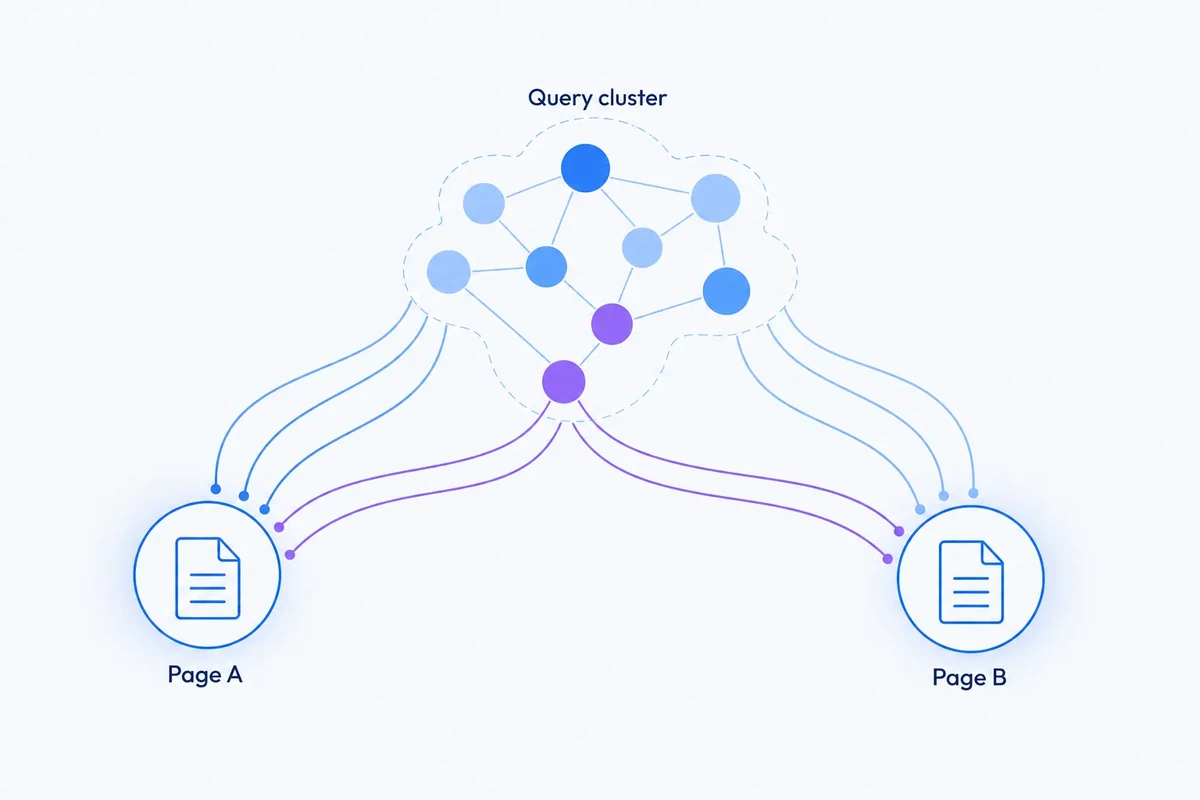
Imagine your keyword clustering software cluster sees a 25% jump in impressions but only a 10% rise in clicks. On a standard report, this looks like a win. However, cluster reporting might reveal that your dominant URL share dropped from 88% to 54%. Why? Because a new blog post is now competing with your main product page for the same commercial queries. A keyword-only view celebrates the visibility; a cluster view flags the cannibalisation risk.
Use page ownership as a first-class metric
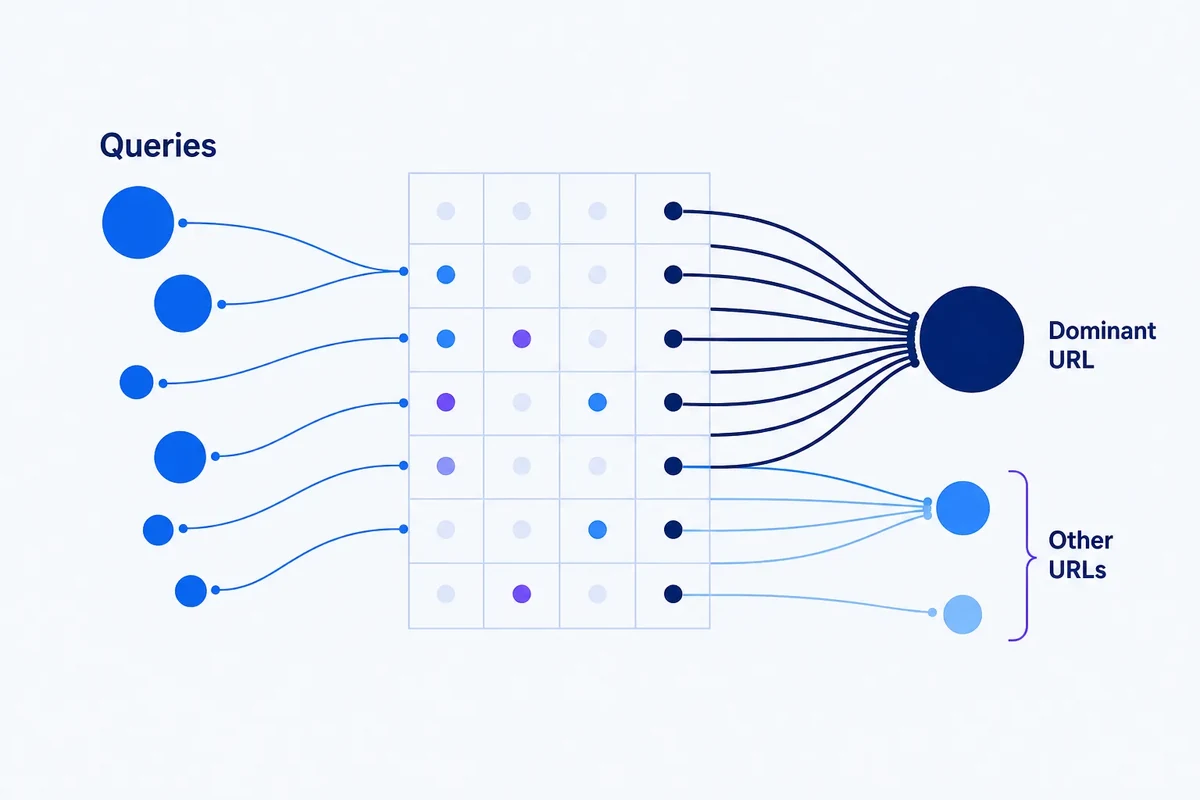
For every topic, you need to know if the site has a clear leader. The logic found in query-page ownership monitoring makes reports actionable by categorising clusters. You can quickly see if you have one clear owner, healthy multi-page presence, or fragmented, unstable ownership where no single page is taking charge.
Coverage status needs nuance
Simply having a URL that mentions a topic is not enough. Coverage should be assessed as strong, shallow, fragmented, or missing. In some cases, you might even mark a topic as not strategically required. This nuanced approach, powered by ClusterIQ's topical coverage model, ensures you are not rewarding the site for thin or irrelevant content.
Trend the cluster, not only the current value
Monthly reporting should identify the trajectory of a topic. Is it growing, stable, or perhaps structurally changing? By comparing recent shifts against a cluster's historical range, you can avoid panicking over normal volatility and focus on genuine strategic problems.
Use weighted summaries carefully
If you are calculating an average position for a cluster, be transparent about the weighting. An average based on search volume tells a very different story than one based on query count. Often, the most useful way to present this is through a distribution showing how many keywords sit in the top 3, positions 4 to 10, or outside the top 20. This is much more intuitive than a single, potentially misleading average.
Separate branded and non-branded views
It is easy for a cluster to look healthy just because brand demand increased while generic visibility stayed flat. By treating brand as a filter or a separate dimension, you can distinguish between people looking for you specifically and new users discovering you through broader search terms.
Keep technical health connected to topics
Cluster reporting can bridge the gap between technical SEO and content. It allows you to see if the pages powering your most important topics are actually indexable, correctly canonicalised, and properly linked. This ensures that technical fixes are prioritised based on the demand they are meant to serve.
Build reports for decisions, not decoration
A good report makes the next step obvious. Whether the data suggests you should improve a page, consolidate overlapping content, or investigate a technical glitch, the output should lead to an action. ClusterIQ helps derive this to-do list from the data while keeping the SEO professional in the driving seat.
Executive and practitioner views should differ
Different stakeholders need different levels of detail. An executive might only need to see trends for ten strategic pillars. A junior SEO, however, might need to monitor 300 clusters, checking ownership confidence and specific action states. The same ClusterIQ model can serve both audiences without the need to rebuild the analysis from scratch.
Avoid the composite-score trap
A single SEO health score is tempting but dangerous if it hides the underlying causes. When using indexes, always display the component measures for demand, visibility, and coverage. This transparency allows users to understand exactly what moved and why.
Practitioner principle: the point of clustering in reporting is not to hide keywords. It is to organise them into units that match real SEO decisions.
ClusterIQ Conclusion
Cluster-level reporting transforms overwhelming keyword lists into a functional operating model. By integrating performance, ownership, and coverage, ClusterIQ explains what is happening at a thematic level while keeping the underlying query data intact. This turns reporting into a tool for prioritisation rather than just a way to prove you have a data subscription.
Use cluster reporting to explain cause before outcome
When clicks drop, your report should help you diagnose the cause. Is it a market-wide decline in demand, a drop in rankings, or internal fragmentation where your own pages are fighting each other? ClusterIQ aligns performance changes with ownership and technical health, giving you a hypothesis to test immediately. This moves SEO away from reactive content creation and towards precise, diagnostic improvements.
Sources and further reading
Farky Rafiq
Founder of ClusterIQ
I've worked in digital marketing since 2005 and founded Liquid Silver in 2011. These articles are where I share the methods, experiments and practical SEO thinking behind ClusterIQ.
Put the idea into practice with your own keyword data
ClusterIQ helps turn raw SEO exports into clean, structured working datasets you can inspect, refine, report on and take into the next stage of your workflow.
Keep reading
Keyword cannibalisation: how clustering helps find overlap without inventing a problem
Building a Search Console query-page matrix for cluster analysis