Measuring topical coverage with clusters without inventing a fake authority score
A coverage model can show where a site is strong or weak without pretending topical authority is one magic number. Learn how to score coverage dimensions separately.

Farky Rafiq
Founder of ClusterIQ
“How much of this topic do we actually cover?” It is a fair question, and a single score would make reporting easier. But topical coverage does not naturally fit into one trustworthy number.
A site can touch many subtopics shallowly, serve a narrow commercial area brilliantly, or have excellent but disconnected pages. Calling any of these “72% topical authority” sounds precise without explaining what you measured.
Measure coverage before authority
Coverage is easier to define and check than authority. Start with a topic map of the subjects your site needs to address, then ask:
- Which expected subtopics have suitable pages?
- Which are shallow or duplicated?
- Which appear in search results?
- Which have relevant internal links?
These are observable conditions, not assumptions about authority.
Use clusters as the denominator carefully
Suppose you group 1,500 keywords into 100 clusters. Content for 80 clusters does not mean “80% authority”. Clusters vary in importance, keyword count, commercial relevance, difficulty and breadth.
Counting covered clusters remains useful, provided you explain what the statistic includes and leaves out.
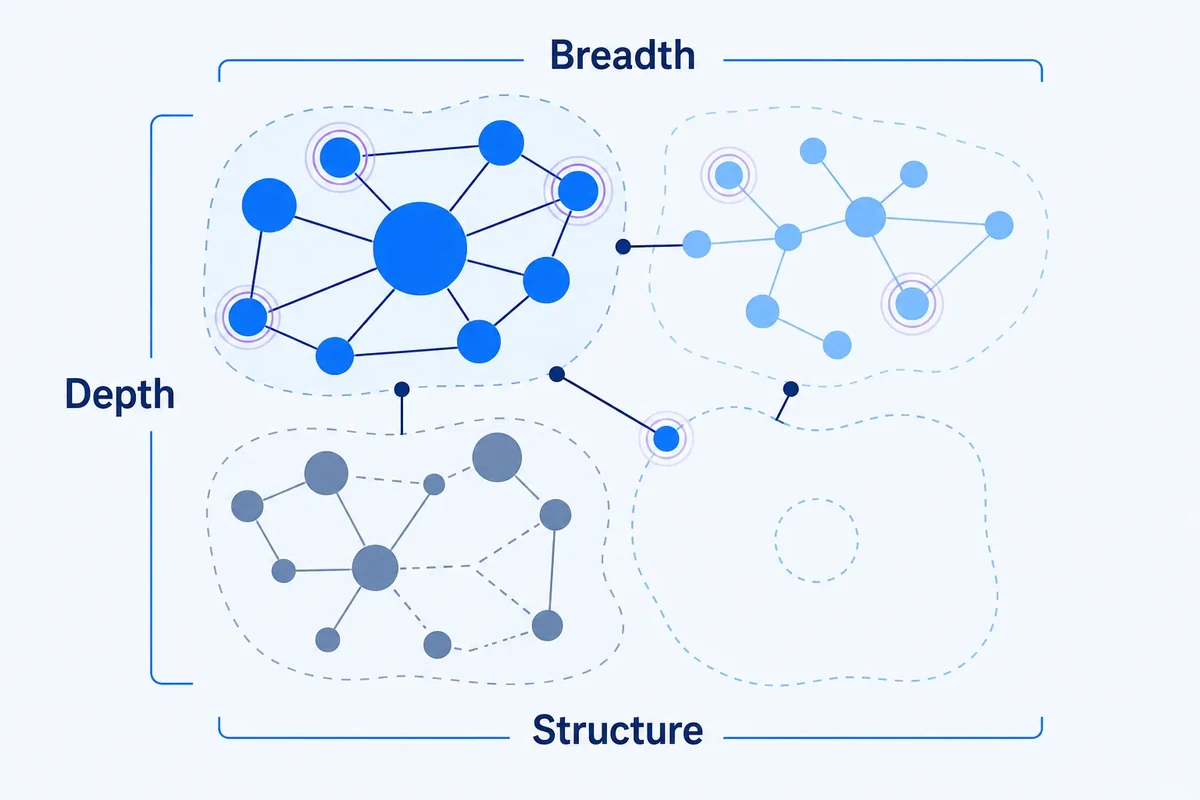
Separate breadth, depth and visibility
Breadth measures how much relevant subject matter you address. Depth assesses how well you serve each important area. Ninety shallow articles might cover more subjects than 40 excellent resources while helping readers less.
Keep search visibility separate too. Google Search Console shows impressions and clicks for searches associated with each cluster. This is performance evidence, not a content-quality verdict: visibility depends on factors beyond topical coverage.
Check structural coverage
A suitable page can exist without meaningful links from related content. Track:
- orphan risk: few or no incoming internal links;
- parent-child links between broad and specific topic pages;
- relevant links between sibling pages;
- navigation depth: clicks needed to reach a page.
This distinguishes connected resources from isolated pages.
Make weighting transparent
If some clusters matter more commercially, assign explicit weights. For example, give core commercial topics 3, important supporting topics 2 and peripheral topics 1.
Weighting involves judgement. Document your choices so business priorities remain visible rather than hidden inside an apparently objective model.
Build a useful coverage table
For each cluster, record:
- importance;
- page coverage status;
- depth assessment;
- search visibility;
- structural links;
- freshness;
- recommended action.
A dashboard can summarise these dimensions while keeping each inspectable. You need not squeeze everything into one score.
Track improvement consistently
Repeat assessments using the same definitions. Track missing clusters, shallow coverage, fragmentation across pages, clusters with suitable main pages and those with meaningful search visibility.
Consistent measures reveal genuine changes and support decisions about what to improve next.
Reward usefulness, not publication
If every new article improves your score, you encourage publishing rather than better coverage. Require new pages to serve a distinct cluster, pass quality review, fit the site structure and avoid unnecessary overlap.
Coverage should reflect whether content meets the user's need, not whether a URL exists. Equally, one strong page may legitimately cover several related clusters. Do not penalise it for lacking a separate URL for each.
Worked example: breadth without depth
A site has pages for 90 of 100 clusters, but 40 pages are thin, outdated or poorly matched to searchers' needs. The headline percentage overstates how well the site serves the topic.
Report 90% topic presence alongside a separate depth assessment. Distinguish strong, fragmented or shallow coverage and missing topics. Figures such as 58% strong, 21% fragmented or shallow and 11% missing require clear definitions and an explanation of remaining categories. They should not be presented as a complete breakdown or assumed to follow from the page count.
Turn coverage into a work queue
A commercially important cluster with weak content and existing page-two visibility may deserve attention before a missing peripheral topic. Let people filter by importance, performance and required work, so the report directs review effort rather than merely displaying impressive numbers.
Use the score as navigation, not truth
If stakeholders need one headline number, present an index with documented components. Show the underlying dimensions alongside it so everyone can see what drives the result.
The index should direct attention, not claim to measure “topical authority” scientifically.
Practitioner principle: measure observable conditions, make judgements visible, and give combined scores no more certainty than their evidence deserves.
ClusterIQ Conclusion
Keyword clusters provide a repeatable framework of subjects and relationships. Track breadth, depth, visibility and structural coverage separately to manage improvements without pretending one score captures everything users or search engines think about your site.
Sources and further reading
Farky Rafiq
Founder of ClusterIQ
I've worked in digital marketing since 2005 and founded Liquid Silver in 2011. These articles are where I share the methods, experiments and practical SEO thinking behind ClusterIQ.
Put the idea into practice with your own keyword data
ClusterIQ helps turn raw SEO exports into clean, structured working datasets you can inspect, refine, report on and take into the next stage of your workflow.
Keep reading
Turning keyword clusters into content briefs without writing the article twice
Topical maps vs content calendars: separating site structure from publishing sequence